


 20 / 38

[20]
Mercado de Trabalho
Mercado Laboral
2014
N.º horas
UE 28
PT
ES
EL
AT
UK
CY
PL
SI
CZ
SK
DE
BE
MT
BG
41,5
42,8
41,6
44,2
43,0
42,9
42,4
42,4
41,9
41,8
41,7
41,5
41,4
41,3
41,2
HR
HU
NL
EE
LU
SE
FR
IT
LV
RO
IE
FI
LT
DK
41,2
40,9
40,9
40,8
40,8
40,8
40,5
40,5
40,5
40,4
40,3
40,0
39,5
38,8
Horas trabalhadas a tempo inteiro, 2014
1
Horas trabajadas a tiempo completo, 2014
1
49
2014
%
2
UE 28
ES
NL
AT
DE
UK
SE
DK
BE
IE
FR
LU
IT
MT
FI
20,5
15,9
50,6
27,9
27,6
26,8
26,2
25,5
24,1
23,5
18,9
18,9
18,4
16,5
15,4
CY
SI
RO
EE
EL
LT
PL
LV
CZ
HU
HR
SK
BG
PT
14,1
11,2
10,0
9,6
9,5
9,1
7,8
7,4
6,4
6,4
6,2
5,2
2,7
13,1
População empregada a tempo parcial, 2014
1
Población ocupada a tiempo parcial, 2014
1
50
Homens
/
Hombres
Mulheres
/
Mujeres
Horas trabalhadas a tempo parcial , 2014
1
Horas trabajadas a tiempo parcial , 2014
1
51
20,4
18,6
17,0
25,0
24,0
23,3
22,8
22,7
22,6
21,4
21,3
21,3
21,1
20,9
20,6
20,5
20,0
20,0
19,9
19,8
19,7
19,6
19,5
19,5
19,5
19,4
19,3
19,1
19,1
19,0
18,6
16,1
25,2
23,6
22,7
21,8
21,4
21,4
21,3
21,2
21,2
20,9
20,8
20,7
20,5
20,2
20,2
20,0
19,9
19,5
19,2
18,7
18,5
18,5
18,1
17,8
16,5
15,2
UE 28
ES
PT
SE
BE
FR
HU
LU
RO
PL
CZ
MT
IT
AT
EE
LT
EL
NL
LV
CY
FI
HR
BG
SI
SK
DE
UK
DK
IE
UE 28
ES
PT
RO
BE
HU
MT
LV
PL
FR
HR
IT
CZ
SE
CY
BG
IE
LT
EE
EL
LU
SK
UK
NL
SI
AT
FI
DE
DK
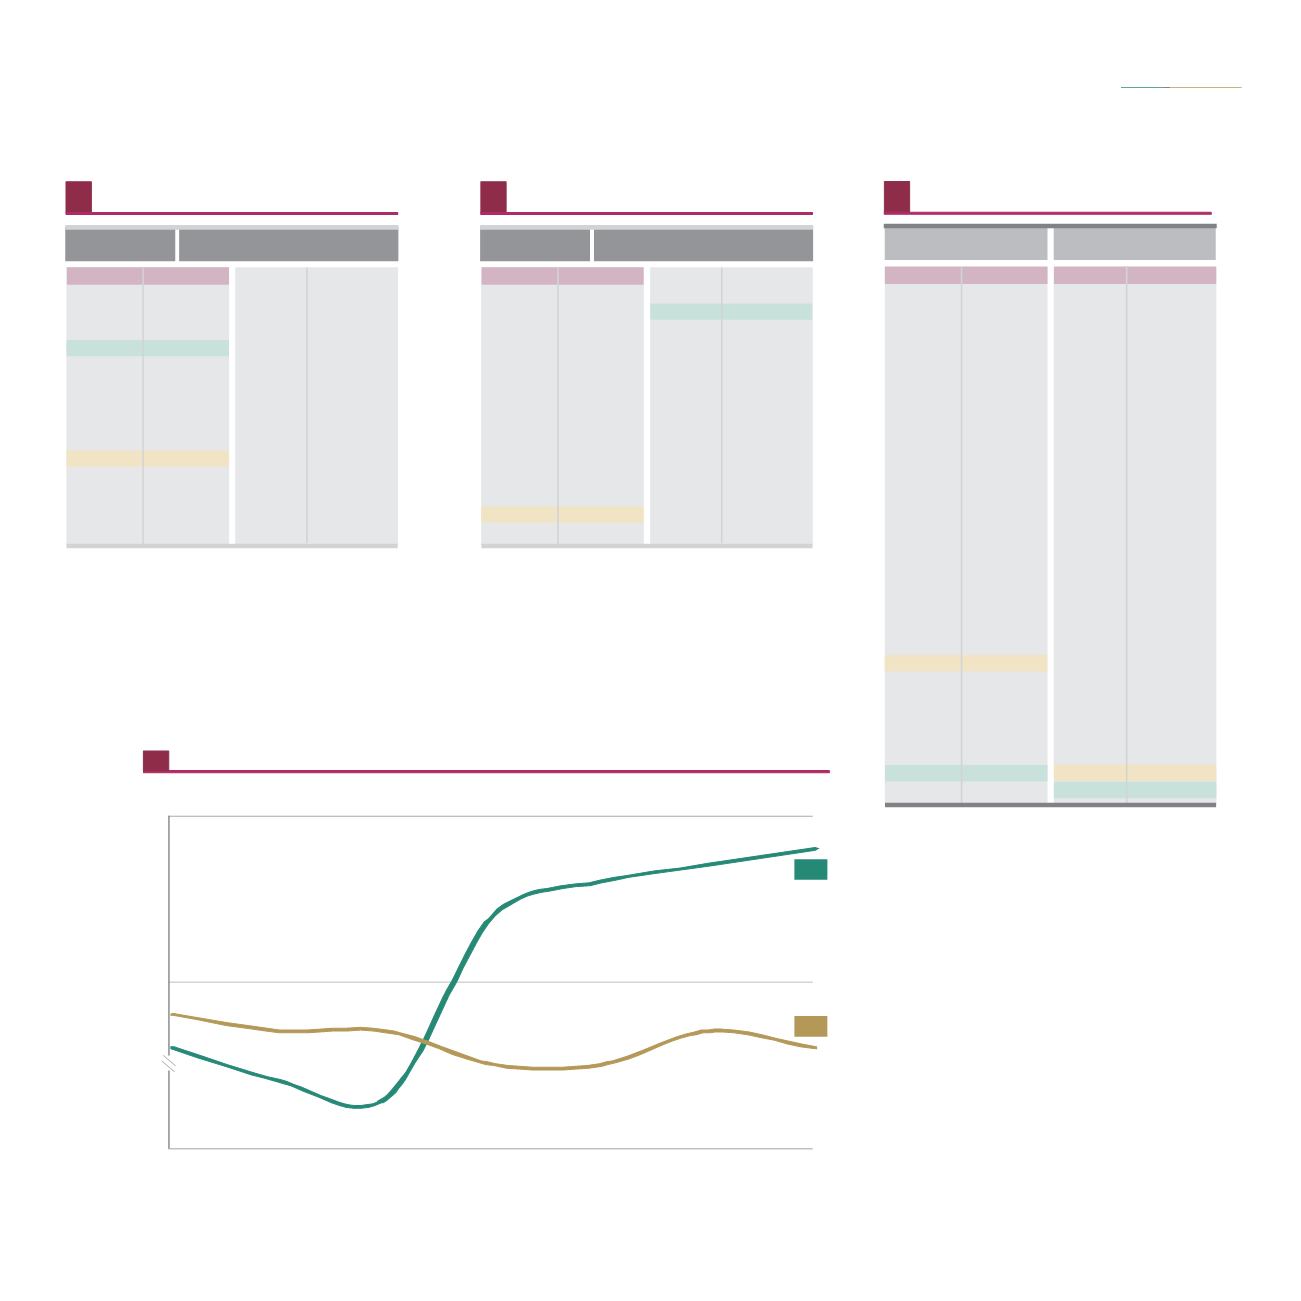
42,8
41,6
41
42
2008
2009
2010
2011
2012
2014
N.º horas
España
2
Portugal
3
Horas trabalhadas a tempo inteiro , 2008-2014
1
/
Horas trabajadas a tiempo completo , 2008-2014
1
52
Península Ibérica
Índice
Contenido
em números
2015
en cifras
Número medio de horas habitualmente trabajadas por semana
Fonte
/
: Eurostat
Fuente
1
Número médio de horas habitualmente trabalhadas por semana
Grupo de edad 15-64 años
Con relación al total de empleados
Fonte
/
: Eurostat
Fuente
1
2
/
/
Grupo etário 15-64 anos
Relativamente ao total de empregados
Número medio de horas habitualmente trabajadas por semana
Fonte
/
: Eurostat
Fuente
1
Número médio de horas habitualmente trabalhadas por semana
2013
Número medio de horas habitualmente trabajadas por semana
Ruptura de serie en 2008 y 2009
Ruptura de serie en 2008 y 2011
Fonte
/
: Eurostat
Fuente
1
2
3
/
/
Número médio de horas habitualmente trabalhadas por semana
Quebra de série em 2008 e 2009
Quebra de série em 2008 e 2011