


 8 / 92

2016
em números
en cifras
in figures
PENÍNSULA IBÉRICA
THE IBERIAN PENINSULA
[8]
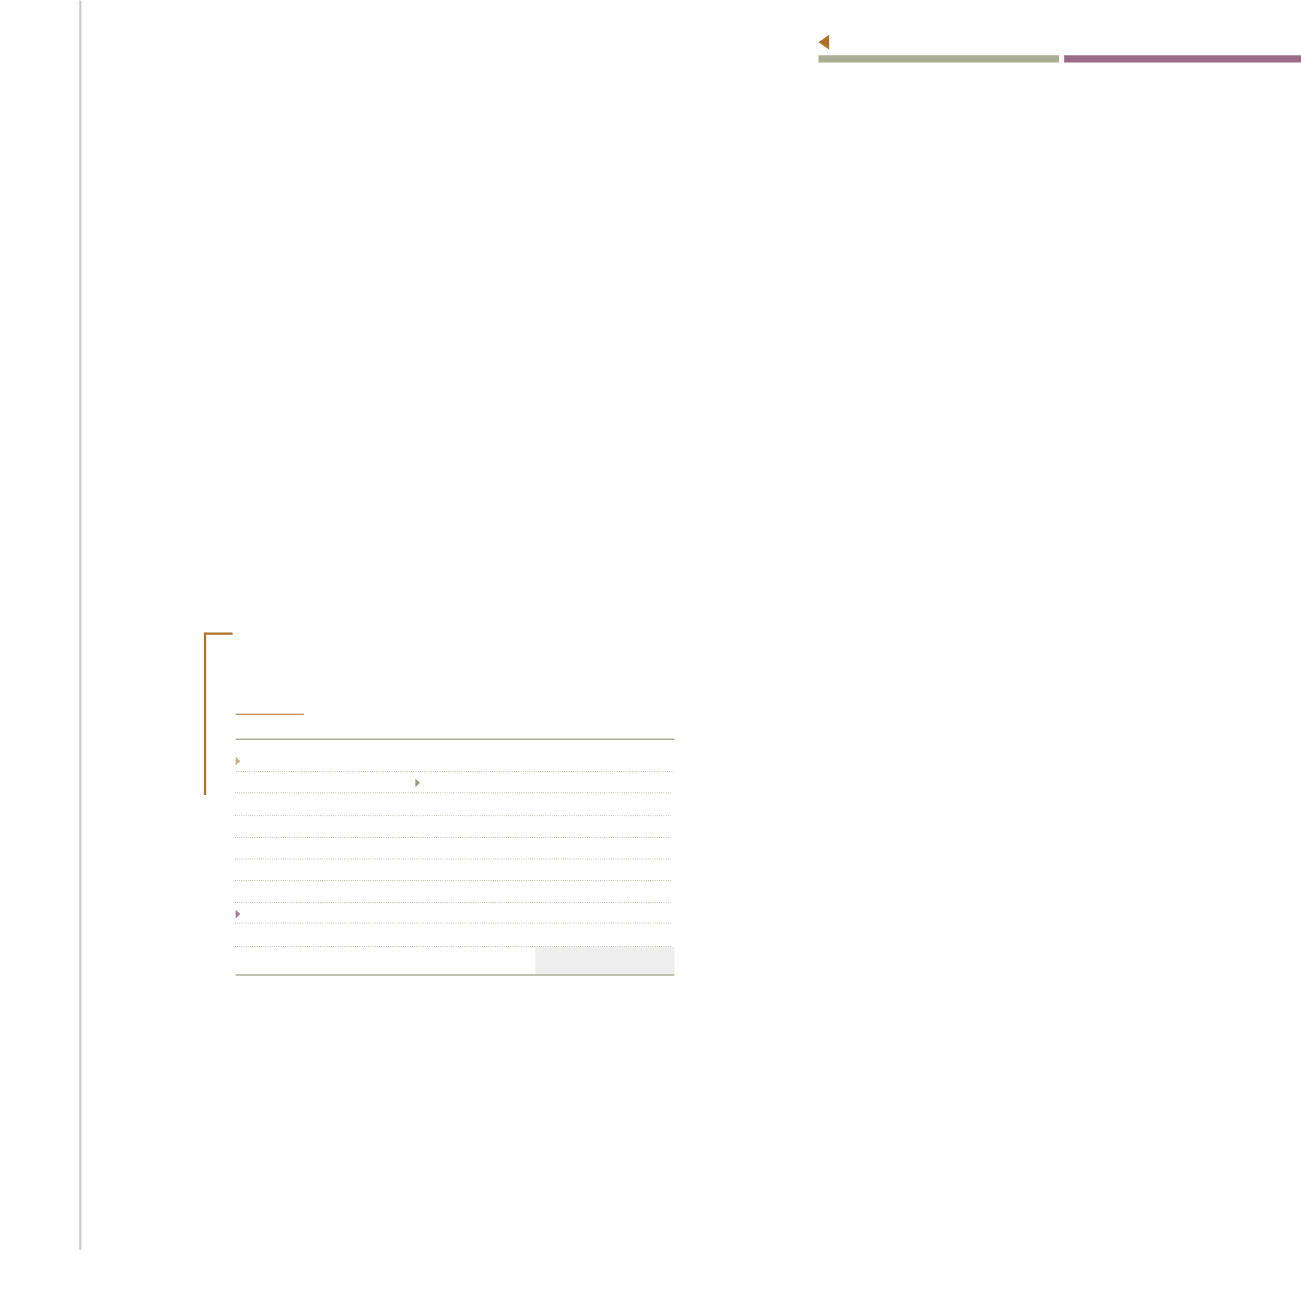
Índice Contenido IndexÁreas terrestres protegidas para a biodiversidade
Áreas terrestres protegidas para la biodiversidad
Protected terrestrial areas for biodiversity
18
38
37
34
30
29
27
27
27
23
21
21
20
19
18
15
15
14
14
13
13
13
13
13
13
12
12
9
8
UE/
EU
28
SI
HR
BG
SK
CY
EL
ES
LU
RO
HU
PT
PL
IT
EE
DE
AT
CZ
FI
BE
IE
FR
MT
NL
SE
LV
LT
UK
DK
Fonte
Fuente
Source:
Eurostat
1
%
da área total do país
del área total del país
of the total area of the country
%
1
2015
BIODIVERSIDADE
Em 2015, a percentagem de território
protegida para biodiversidade era maior em
Espanha (27%) do que em Portugal (21%).
Porém, ambos os países apresentaram
valores superiores ao registado para o
conjunto da UE 28: 18%. Mas existem grandes
diferenças, neste domínio, entre os países
que constituem a União Europeia, com o
máximo a registar-se na Eslovénia (38%) e o
mínimo na Dinamarca (8%).
Território e Ambiente
Territorio y Medio Ambiente
Territory and Environment
BIODIVERSITY
In 2015, the percentage of protected
areas for biodiversity was higher in Spain
(27%) than in Portugal (21%). However,
both countries presented higher values
than those recorded for the EU 28 as
a whole: 18%. Nonetheless, there are
major differences in this approach
between the countries of the European
Union, with the highest occurring
in Slovenia (38%) and the lowest in
Denmark (8%).
BIODIVERSIDAD
En 2015, el porcentaje de superficie
protegida para la biodiversidad es mayor
en España (27%) que en Portugal (21%),
aunque superior al valor registrado en
el conjunto de la UE 28: 18%. Existen
diferencias en este ámbito dentro de
los países que constituyen la Unión
Europea, con un máximo que se registra
en Eslovenia (38%) y un mínimo en
Dinamarca (8%).