


 9 / 92

PENÍNSULA IBÉRICA
THE IBERIAN PENINSULA
[9]
Índice Contenido IndexTerritório e Ambiente
Territorio y Medio Ambiente
Territory and Environment
Resíduos urbanos recolhidos e tratados
1
, 2006-2014
Residuos urbanos recogidos y tratados
1
, 2006-2014
Municipal waste generation and treatment
1
, 2006-2014
Resíduos urbanos reciclados, 2005-2014
Residuos urbanos reciclados, 2005-2014
Municipal waste recycled, 2005-2014
Fonte
Fuente
Source:
Eurostat
1
Todos ao resíduos urbanos recolhidos foram tratados
Todos los residuos urbanos recogidos fueron tratados
All the waste generated was treated
2
Dado estimado para 2014
Dato estimado para 2014
2014: Estimated
Fonte
Fuente
Source:
Eurostat
1
Dado estimado para 2014
Dato estimado para 2014
2014: Estimated
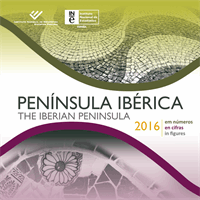
RESÍDUOS
Entre 2006 e 2014, na Espanha houve uma
redução clara e contínua da quantidade de
resíduos recolhidos: de 590 kg/hab. para
435 kg/hab.; em Portugal, esta realidade
registou oscilações no período considerado,
com um pico nos anos 2008, 2009 e 2010
(518, 520 e 516 kg/hab., respetivamente)
e um valor no final da série (435 kg/hab.)
que é próximo do seu início (465 kg/hab.)
Ambos os países trataram a totalidade dos
resíduos urbanos recolhidos.
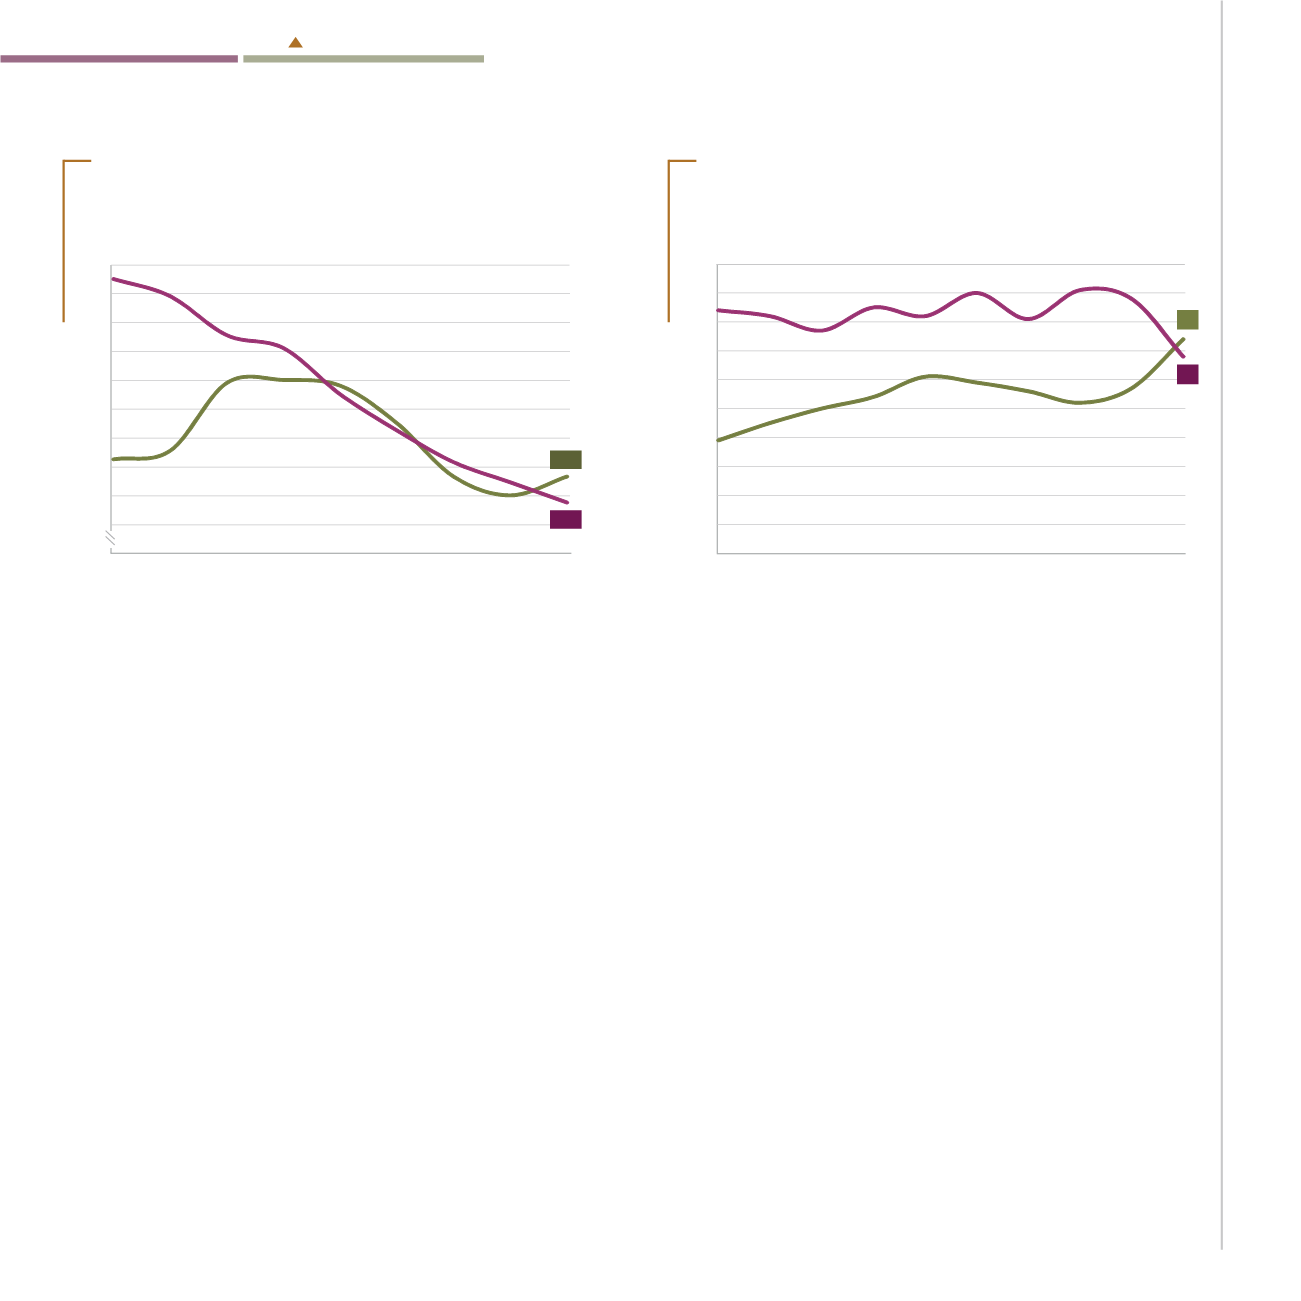
Quanto à reciclagem de resíduos urbanos,
a Espanha registou, durante muito tempo,
valores mais elevados do que Portugal.
Contudo, esta realidade tem vindo a
alterar-se em sentidos diferentes e, em
2014, o valor registado no nosso país
(74 kg/hab.) foi superior ao de Espanha
(68 kg/hab.).
RESIDUOS
Entre 2006 y 2014, en España hubo
una reducción clara y continua de la
cantidad de residuos recogidos: de
590 kg/hab. a 435 kg/hab. En Portugal
estos registraron oscilaciones en el
periodo considerado, con máximos en
2008, 2009 y 2010 (518, 520 y 516 kg/
hab., respectivamente) hasta un valor
final de la serie (435 kg/hab.) similar al
de inicio (465 kg/hab.). Ambos países
trataron la totalidad de los residuos
urbanos recogidos.
En cuanto al reciclaje de residuos
urbanos, España registró durante
mucho tiempo valores más elevados
que Portugal. Esta tendencia cambió
en sentido contrario y, en 2014, el valor
registrado en Portugal (74 kg/hab.) fue
superior al de España (68 kg/hab.).
WASTE
In the period 2006 to 2014, there was
a clear and continuous reduction of the
amount of collected waste in Spain: from
590 kg/inhab. to 435 kg/inhab.; in Portugal,
this situation registered different outcomes
in the period considered, with a peak in
2008, 2009 and 2010 (518 kg, 520 kg and
516 kg /inhab., respectively) and a value
at the end of the series (435 kg/inhab.)
which is close to the value recorded at the
beginning (465 kg/inhab). Both countries
treated all the municipal waste collected.
Concerning the recycling of municipal
waste, Spain has for a long time registered
higher values than Portugal. However, this
reality has changed in opposite directions
and, in 2014, the value registered in
Portugal (74 kg/inhab.) was higher than
that of Spain (68 kg/inhab.).
420
440
460
480
500
520
540
560
580
600
2006
2007 2008
2009 2010
2011 2012 2013
435
453
España
2
Portugal
2014
2005
0
10
20
30
40
50
60
70
80
90
100
2006 2007 2008 2009 2010 2011 2012 2013
68
74
España
1
Portugal
2014
kg/hab.
kg/inhab.
kg/hab.
kg/inhab.