
PENÍNSULA IBÉRICA
THE IBERIAN PENINSULA
[51]
Índice Contenido IndexContas Nacionais
Cuentas Nacionales
National Accounts
PIB
PER CAPITA
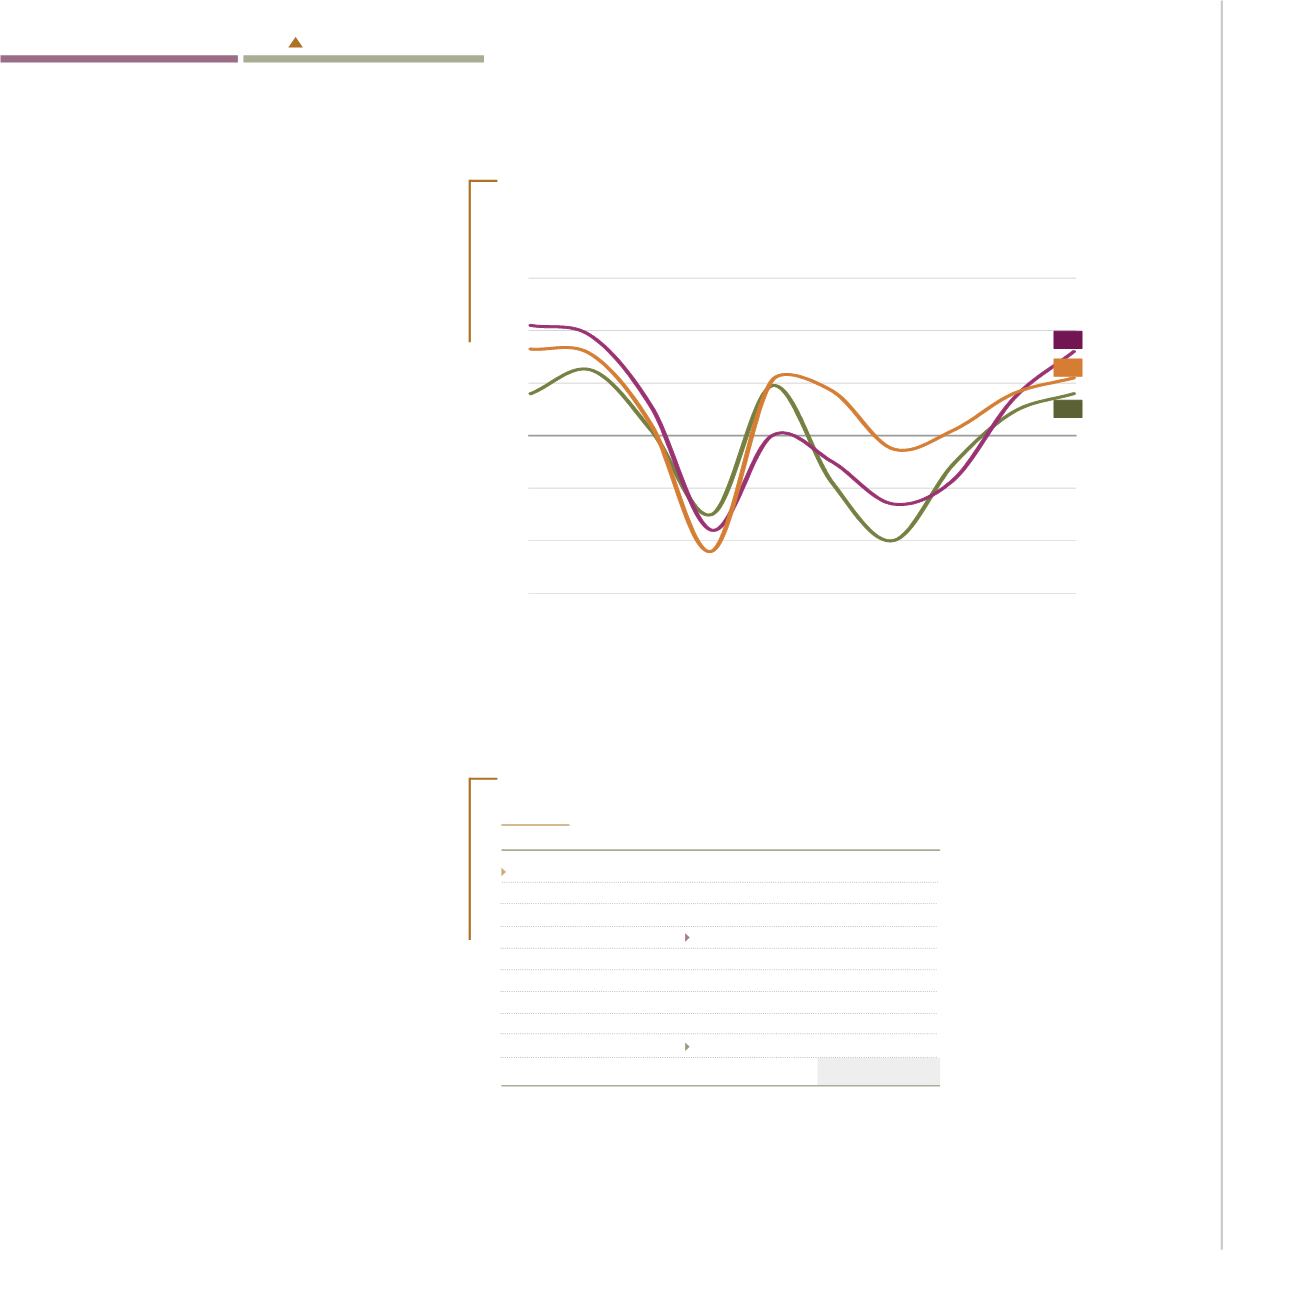
No período 2006-2015, o PIB
per capita
em Portugal foi sempre inferior ao
verificado em Espanha, apesar deste ter
registado uma descida mais acentuada.
A nível da União Europeia, o valor mais
elevado registou-se no Luxemburgo e o
mais baixo na Bulgária.
PIB PER CÁPITA
En 2006-2015, el PIB per cápita
en Portugal fue siempre inferior
al registrado en España, a pesar
de comenzar con una caída más
pronunciada a comienzos del periodo.
A nivel de Unión Europea, el valor más
alto al final del periodo se registró en
Luxemburgo y el más bajo en Bulgaria.
GDP PER CAPITA
In the period 2006-2015, GDP per capita
in Portugal was always lower than
in Spain, in spite of the latter having
registered a more pronounced decline in
this period.
In what concerns the European Union,
the highest figure was in Luxembourg
and the lowest in Bulgaria.
PIB
per capita
em PPS
1
PIB
per cápita
en PPA
1
GDP
per capita
in PPS
1
108
106
95
92
89
85
83
81
77
77
100
271
145
129
127
125
124
123
117
110
74
74
71
69
68
64
58
57
46
UE/
EU
28
LU
IE
NL
AT
DE
DK
SE
BE
UK
FI
FR
IT
ES
MT
CZ
SI
CY
PT
SK
EE
LT
EL
PO
HU
LV
HR
RO
BG
Fonte
Fuente
Source:
Eurostat
1
Paridades de Poder de Compra Padrão (UE 28 = 100)
Paridades de Poder Adquisitivo (UE 28 = 100)
Purchasing Power Standards (EU 28 = 100)
PPS/
PPA
2015
Fonte
Fuente
Source:
Eurostat
1
Dados provisórios para toda a série
Datos provisionales en toda la serie
2006-2015: Provisional data for all the series
2
Dado estimado para 2015
Dato estimado para 2015
2015: Estimated
Taxa de variação anual do PIB a preços constantes (base = 2011), 2006-2015
Tasa de variación anual del PIB a precios constantes (base = 2011), 2006-2015
Real GDP growth rate on previous year at current prices (base = 2011), 2006-2015
-2,0
-4,0
-6,0
0,0
2,0
4,0
6,0
2006 2007 2008 2009 2010 2011 2012
2015
%
1
España
2
Portugal
2013
2,2
3,2
1,6
2014
UE/ 28
EU


